+1 305 433 3385 (FL), +1 415 625 1795 (CA)contact@bigdatarealty.com

South Florida Inventory Dashboard Q3 2023

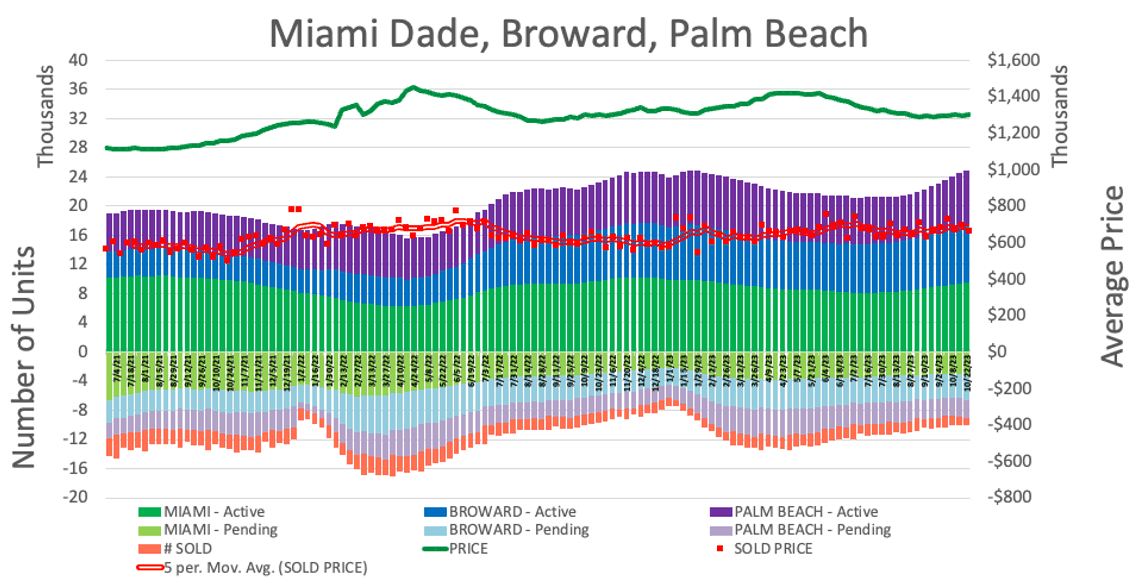
After some stabilization during summer, inventory levels started to accumulate while asking prices decreased by 10% from their peaks. Inventories were approaching levels last seen near the beginning of the pandemic.

Report period: Q3 2023

South Florida residential inventory overview for Q3 2023

Miami-Dade County

While still at a record low, the number of single-family homes in Miami-Dade County started to increase. The average asking price was about $2.5 million, while the average sold price was just above $1 million.
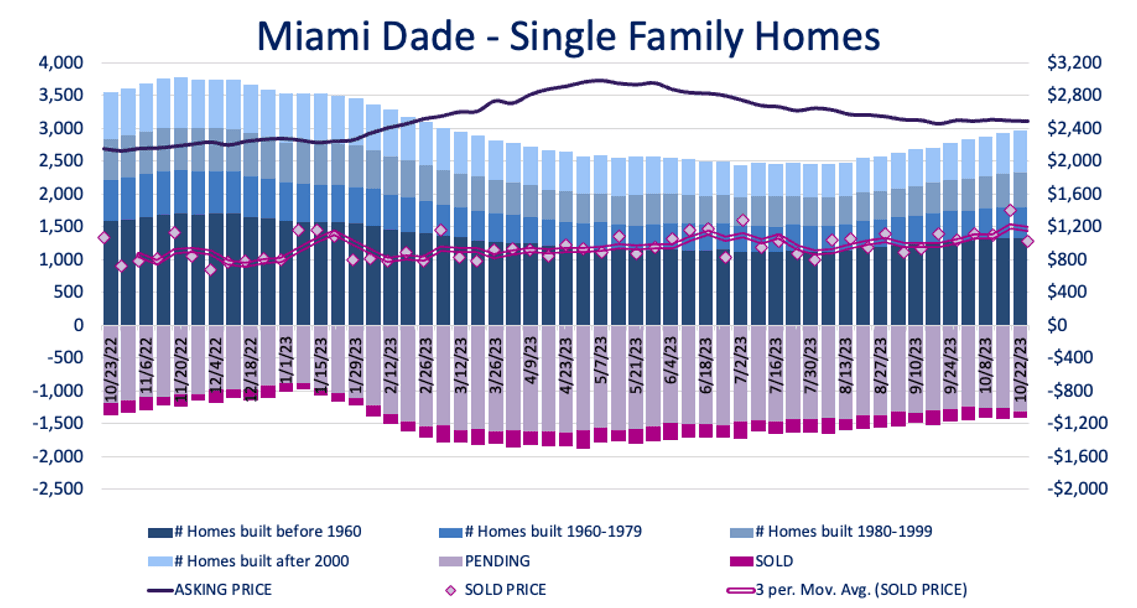
Miami-Dade County single-family inventory chart, Q3 2023

Condo inventory remained at record-low levels. The average asking price was about $1.25 million, while the average sold condo price was $583,000.
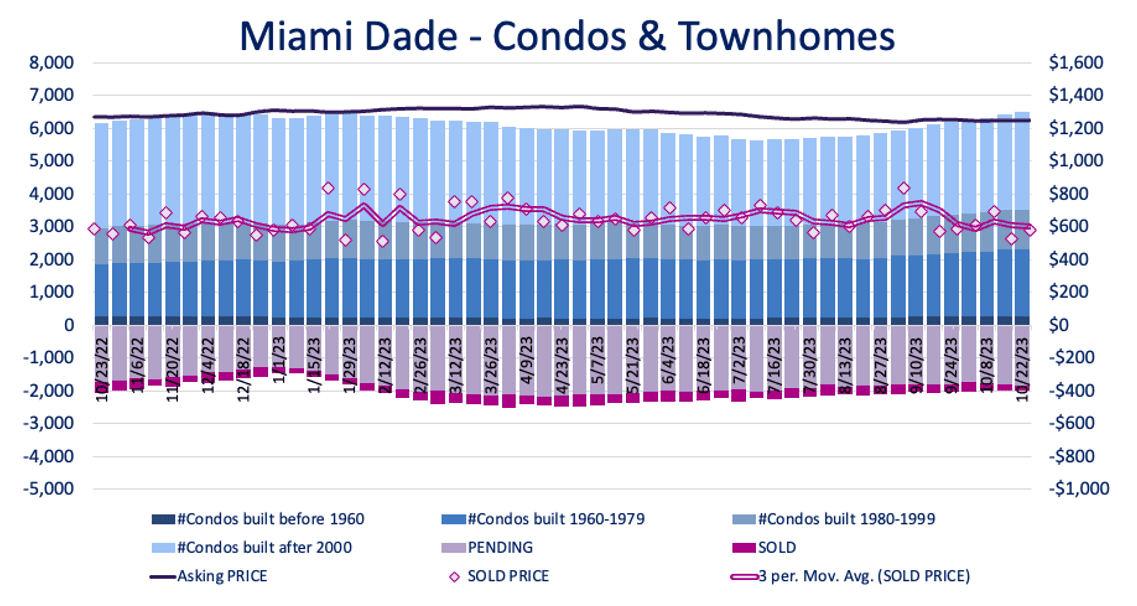
Miami-Dade County condominium inventory chart, Q3 2023

Broward County

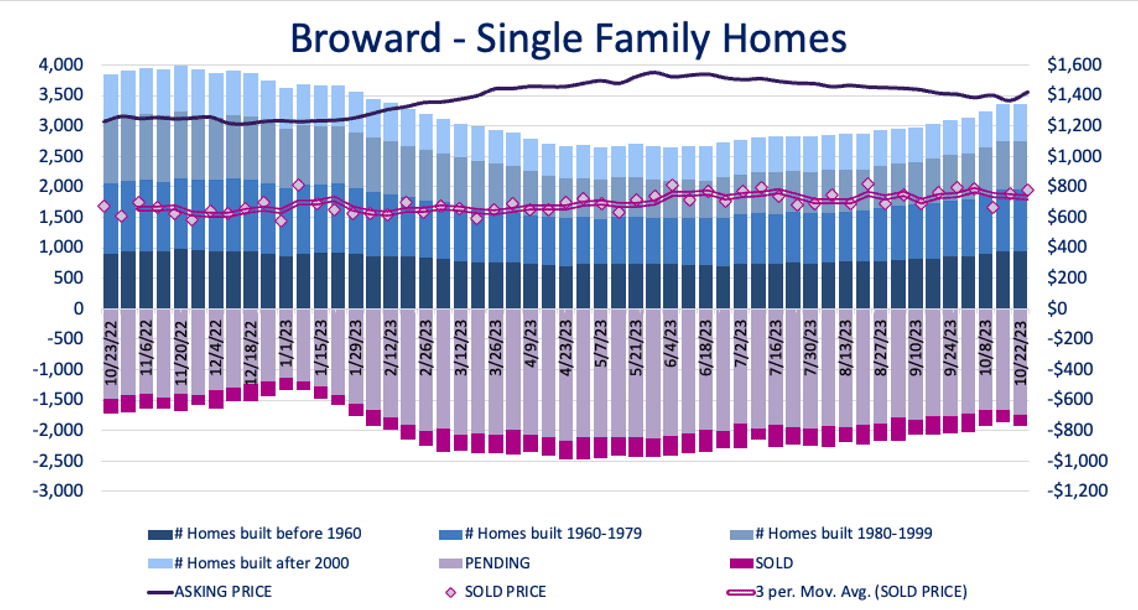
While still at a record low, the number of single-family homes in Broward County was also increasing. The average asking price was about $1.4 million, while the average sold price was $770,000.

Broward County single-family inventory chart, Q3 2023

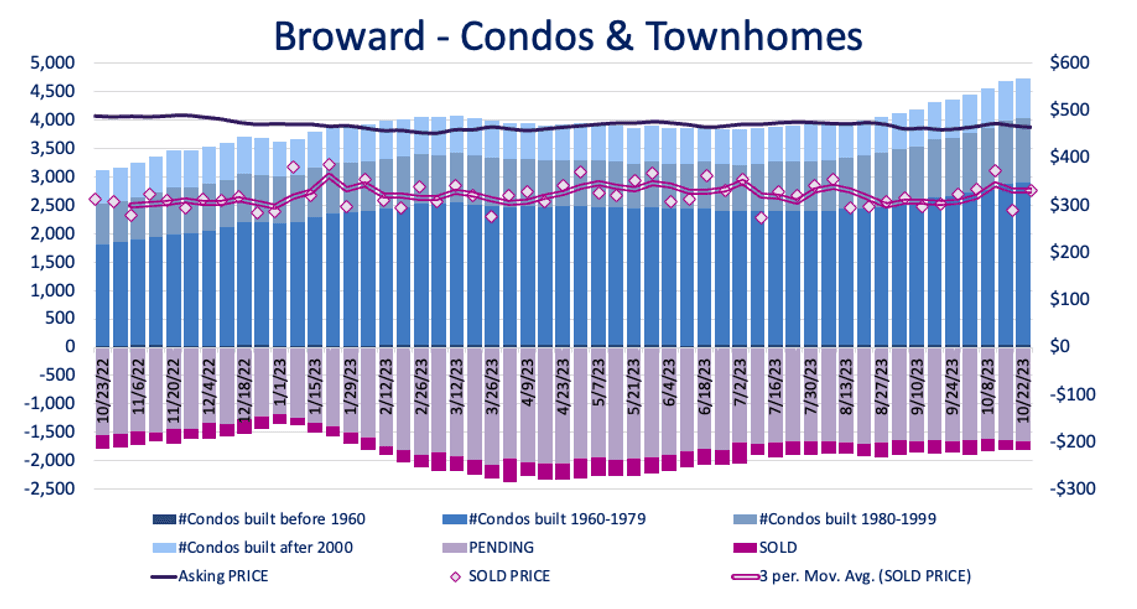
Condo inventory was increasing quickly. The average asking price was about $465,000, while the average sold condo price was $330,000.

Broward County condominium inventory chart, Q3 2023

Palm Beach County

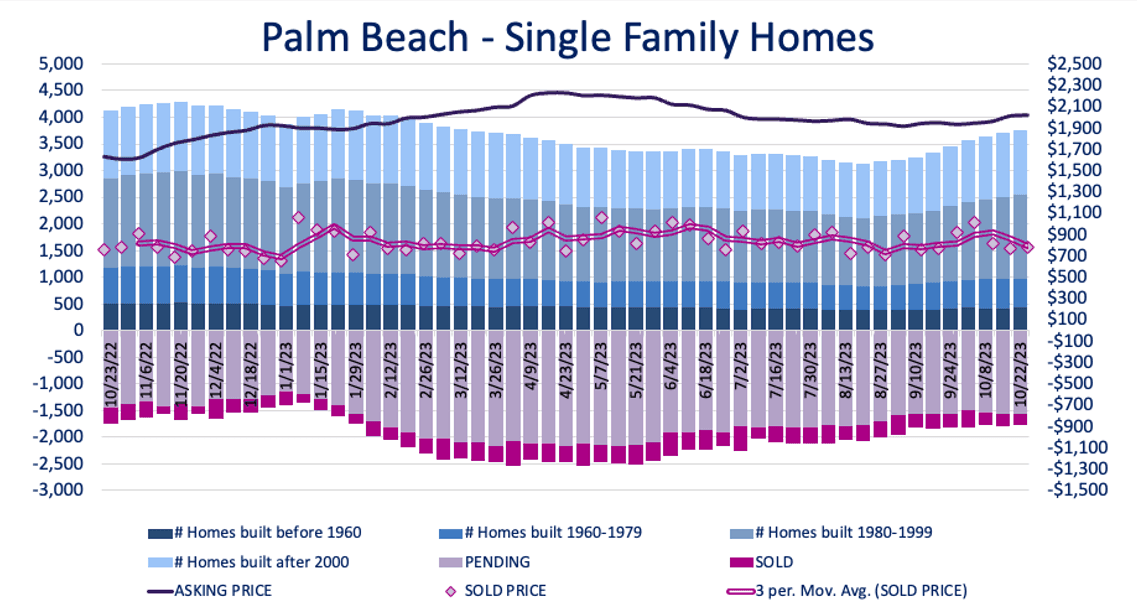
The number of single-family homes in Palm Beach County was increasing steadily from the summer minimum. The average asking price was about $2 million, while the average sold price was $785,000.

Palm Beach County single-family inventory chart, Q3 2023

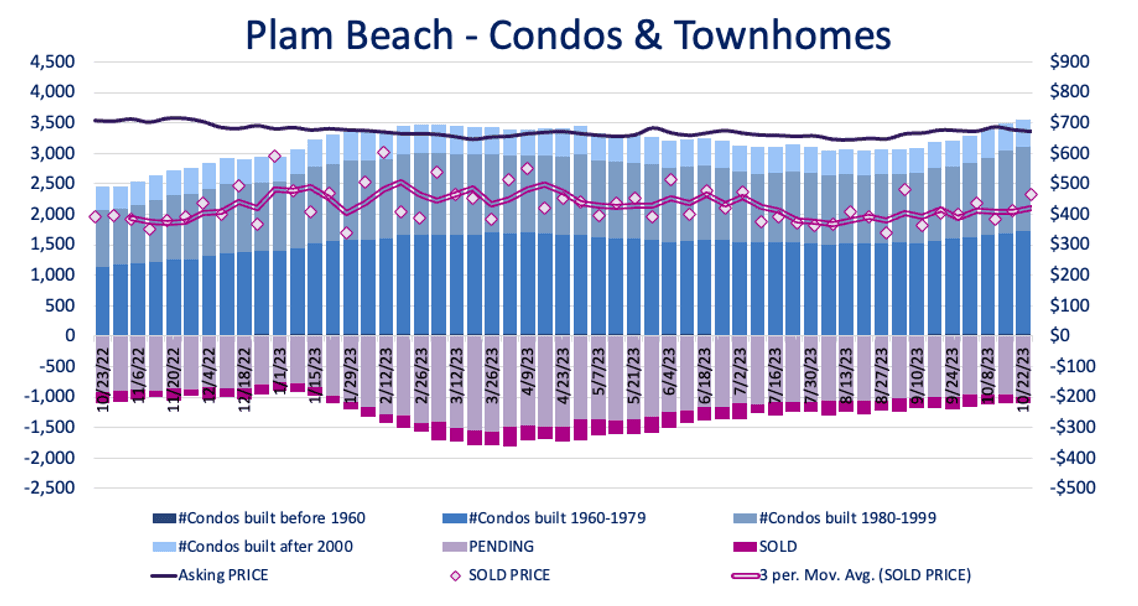
Condo inventory was also increasing. The average asking price was about $670,000, while the average sold condo price was $466,000.

Palm Beach County condominium inventory chart, Q3 2023

Ask Big Data Realty

Ask about an inventory report

Tell us what you are trying to understand. We will use your details only to respond to your request.